Benefits & Reports from the EUREQUO Database
Reports are available through the web site (www.eurequo.net). Just log in and click on “Reporting”.
Then you will have two choices:
- cataract surgery or
- refractive surgery
Each report consists of a Report parameters and a Results section. Once the report has been created, the results are displayed directly beneath the area where the parameters have been entered.
Depending on whether it is a graphical or a text-based report, the user can generate a CSV-export (only for text-based reports) or a PDF-export.
When you choose one type of surgery you can then choose between taking out a:
- preoperative and surgical report or a
- follow up report
These reports are frequency tables with your own data (or clinic), the data of your country and also the data of the total database. This means that the frequency data will appear in three columns with your own data to the left, data from your country in the middle and total database to the right. A sample is reported below:
| Infotext | Surgeon | selected period | Country | whole period | EUREQUO | whole period |
| Number of operations | 27 | 100.00% | 72498 | 100.00% | 229395 | 100.00% |
| Gender | ||||||
| Female | 19 | 70.37% | 44125 | 60.86% | 138976 | 60.58% |
| Male | 8 | 29.63% | 28373 | 39.14% | 90419 | 39.42% |
When you take out a frequency table report you can make a number of selections. This means that you can take out a report with selections on gender, age, occurrence of a certain ocular co-morbidity or complex surgery. For refractive surgery you can also make selections on type of surgery and preoperative refraction. The figure below shows reports available from the system:
It is also possible to get reports with graphs. For cataract surgery it will be graphs showing the visual outcome, the refractive outcome and the occurrence of a capsule complication.
For refractive surgery you can get standard graphs showing your own performance.
If you want to do own statistical calculations you can export all your own data as an Excel file by clicking in the same page of reporting Export service.
Features – Cataract Surgery
Frequency tables
| Infotext | Surgeon | selected period | Country | whole period | EUREQUO | whole period |
| Number of operations | 27 | 100.00% | 72498 | 100.00% | 229395 | 100.00% |
| Gender | ||||||
| Female | 19 | 70.37% | 44125 | 60.86% | 138976 | 60.58% |
| Male | 8 | 29.63% | 28373 | 39.14% | 90419 | 39.42% |
| Part of a frequency table report (Cataract: preoperative and surgical data) with data for surgeon, country and all database. |
||||||
Graphs
The graphs can be used for benchmarking. Below is a graph showing the percentage of patients achieving a best corrected visual acuity after surgery of 0.5 or better. The requesting surgeon’s result is shown in red and other surgeon’s result in green. This graph shows all cases, but selection can be done on best cases etc.
GRAPH 1: BCVA Surgery eye >= 0.5 | (6/12) at final follow-up in progress
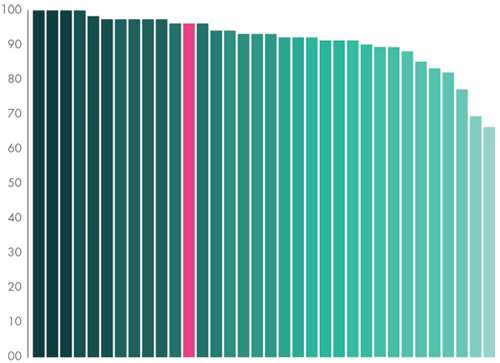
Percentage of patients achieving a final best corrected visual acuity of 0.5 or better
Below is another graph showing the refractive outcome. It is a box-plot diagram showing the deviation from target refraction with correct signs. Each box represents a surgeon or a clinic. Requesting surgeon is marked in red, others in green. The middle 50% of the values are within the box and 95% within the whiskers. The box-plot diagram shows both the central tendency and the spread of values.
GRAPH 2: Biometry prediction error, boxchart with correct signs
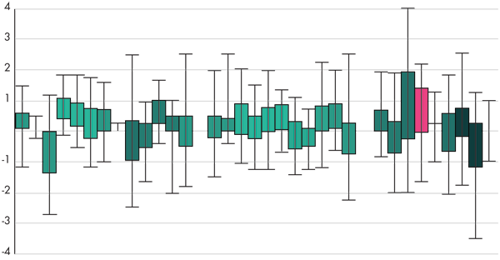
Box-plot diagram showing the biometry prediction error with correct signs
Features – Refractive Surgery
Frequency tables
| Infotext | Surgeon | selected period | Country | whole period | EUREQUO | whole period |
| Number of operations | 0 | 0.00% | 269 | 100.00% | 5969 | 100.00% |
| Eye | ||||||
| OD | 0 | 0.00% | 134 | 49.81% | 3014 | 50.49% |
| OS | 0 | 0.00% | 135 | 50.19% | 2954 | 49.49% |
| Part of a frequency table report for refractive surgery. | ||||||
Graphs
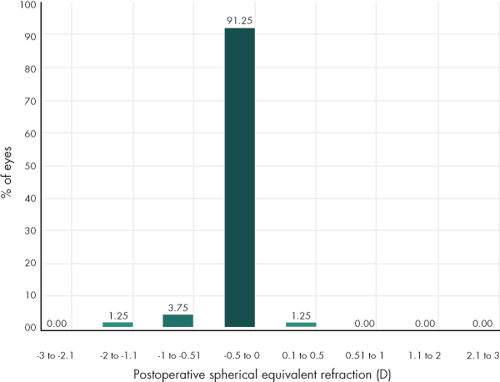
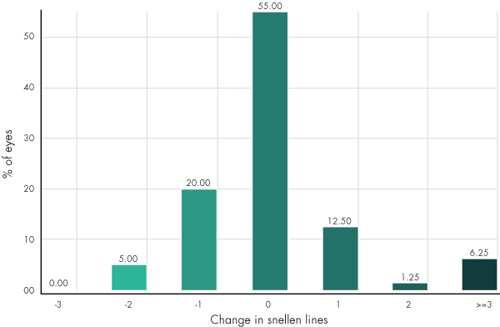
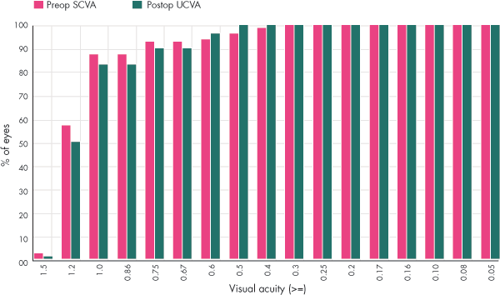
From refractive surgery the system gives the generally accepted standard graphs for refractive surgery. These graphs contain only data for the requesting surgeon or clinic.
GRAPH 1: Attempted versus achieved refraction
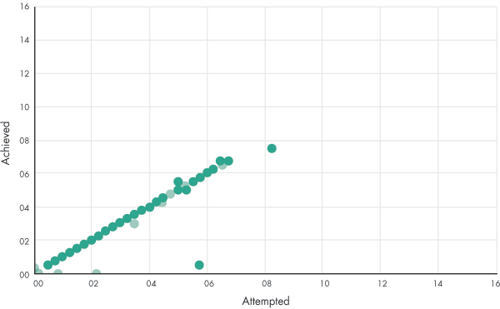
GRAPH 2: Change in Snellen lines, surgery eye
GRAPH 3: Preoperative spectacle corrected VA and postoperative uncorrected VA
GRAPH 4: Postoperative spherical equivalent
