Getting to grips with astigmatism
Free-to-download double-angle plot tool offers clear, precise astigmatism data analysis

Dermot McGrath
Published: Saturday, February 1, 2020
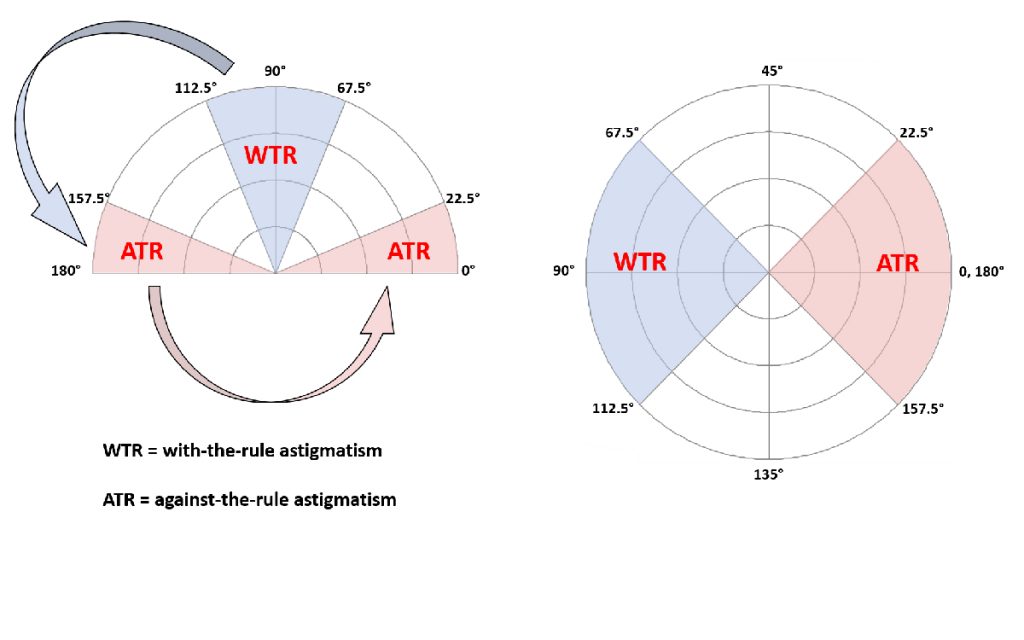 As Figure 1 from JCRS guest editorial illustrates, all with-the-rule data (WTR) points are displayed on the left of the vertical axis, and against-the-rule (ATR) data are displayed to the right of it.[/caption]
A double-angle plot tool that can be used by clinicians and researchers to display standardised vectoral astigmatism outcomes is now available for download via the ESCRS, ASCRS, and JCRS websites.
The tool, which has been refined and improved over many years of research, enables clinicians to generate three figures and associated outcomes data that are optimal for describing all forms of astigmatism and astigmatic change. With it, clinicians can quickly and easily evaluate their current surgical outcomes and fine-tune their approach to potentially improve future outcomes.
The key difference with this tool, unlike the some of the other plot tools currently available, is that it uses double-angle plots to display astigmatism data.
“The double-angle plot is critical to displaying astigmatism data properly,” explains Douglas Koch MD, Professor in Ophthalmology at the Baylor College of Medicine in Houston, Texas, and one of the key figures behind the development of the tool. He acknowledges colleagues Adi Abulafia, Jack Holladay, Li Wang and Warren Hill as collaborators in developing the tool and writing the accompanying 2018 JCRS guest editorial.
“Double-angle plots are clear and precise for graphic display of astigmatic data. The relationship of data points, the centroids, and the 95% confidence ellipses can only be accurately displayed on a double-angle plot. This plot is not available in standard software such as EXCEL and can only be found in expensive statistical software such a SPSS, SAS, and XLSTAT costing thousands of dollars. The double-angle plot tool is simple to download and use, and it displays outcomes correctly by simply entering the required data,” he said.
As Dr Koch notes, the concept of doubling the angles for astigmatic analysis is not new.
“It actually goes back 170 years to Stokes’ original presentation in 1849, so it is fair to say that this is the original way to evaluate astigmatism. It was applied by Jaffe and Clayman in their classic 1975 article. However, Jack Holladay deserves credit for introducing it into contemporary astigmatism analysis with his initial article in 1992, which was followed by several additional publications by him and by others applying his methodology. It was even adopted by the Journal of Refractive Surgery in 2006, with Dr Malvina Eydelman as lead author,” he said.
[caption id="attachment_17842" align="alignleft" width="1024"]
As Figure 1 from JCRS guest editorial illustrates, all with-the-rule data (WTR) points are displayed on the left of the vertical axis, and against-the-rule (ATR) data are displayed to the right of it.[/caption]
A double-angle plot tool that can be used by clinicians and researchers to display standardised vectoral astigmatism outcomes is now available for download via the ESCRS, ASCRS, and JCRS websites.
The tool, which has been refined and improved over many years of research, enables clinicians to generate three figures and associated outcomes data that are optimal for describing all forms of astigmatism and astigmatic change. With it, clinicians can quickly and easily evaluate their current surgical outcomes and fine-tune their approach to potentially improve future outcomes.
The key difference with this tool, unlike the some of the other plot tools currently available, is that it uses double-angle plots to display astigmatism data.
“The double-angle plot is critical to displaying astigmatism data properly,” explains Douglas Koch MD, Professor in Ophthalmology at the Baylor College of Medicine in Houston, Texas, and one of the key figures behind the development of the tool. He acknowledges colleagues Adi Abulafia, Jack Holladay, Li Wang and Warren Hill as collaborators in developing the tool and writing the accompanying 2018 JCRS guest editorial.
“Double-angle plots are clear and precise for graphic display of astigmatic data. The relationship of data points, the centroids, and the 95% confidence ellipses can only be accurately displayed on a double-angle plot. This plot is not available in standard software such as EXCEL and can only be found in expensive statistical software such a SPSS, SAS, and XLSTAT costing thousands of dollars. The double-angle plot tool is simple to download and use, and it displays outcomes correctly by simply entering the required data,” he said.
As Dr Koch notes, the concept of doubling the angles for astigmatic analysis is not new.
“It actually goes back 170 years to Stokes’ original presentation in 1849, so it is fair to say that this is the original way to evaluate astigmatism. It was applied by Jaffe and Clayman in their classic 1975 article. However, Jack Holladay deserves credit for introducing it into contemporary astigmatism analysis with his initial article in 1992, which was followed by several additional publications by him and by others applying his methodology. It was even adopted by the Journal of Refractive Surgery in 2006, with Dr Malvina Eydelman as lead author,” he said.
[caption id="attachment_17842" align="alignleft" width="1024"] A: Cumulative histogram of the magnitude of the preoperative corneal and postoperative refractive astigmatism, vertexed to the corneal plane (n=78). Means and SDs are also shown[/caption]
As Dr Koch sees it, the tool is extremely versatile in describing astigmatism and astigmatic change in clear and precise graphical form.
“I think it is especially useful when comparing prediction errors of astigmatism with formulas and devices where centroids and confidence ellipses are necessary for comparison, just as means and confidence intervals are used for single variables,” he said.
[caption id="attachment_17840" align="alignleft" width="1024"]
A: Cumulative histogram of the magnitude of the preoperative corneal and postoperative refractive astigmatism, vertexed to the corneal plane (n=78). Means and SDs are also shown[/caption]
As Dr Koch sees it, the tool is extremely versatile in describing astigmatism and astigmatic change in clear and precise graphical form.
“I think it is especially useful when comparing prediction errors of astigmatism with formulas and devices where centroids and confidence ellipses are necessary for comparison, just as means and confidence intervals are used for single variables,” he said.
[caption id="attachment_17840" align="alignleft" width="1024"] B: Double-angle plots of the preoperative corneal and the postoperative refractive astigmatism (n=78). Centroids and SDs are also shown[/caption]
The double-angle plots display data more clearly and allow for superior methods of statistical analysis compared to tools that use single-angle plots, said Dr Koch.
“Kristian Næser has made a huge contribution here with his elegant method of statistical analysis. The key difference is this – with single-angle plots, against-the-rule data are split on either side of the graph. With double-angle plots, both with-the-rule and against-the-rule data are grouped accordingly, allowing easy visualisation of trends, data centroids, confidence intervals and standard deviations,” he said.
As Dr Koch sees it, there is nothing inherently difficult in understanding double-angle plots once the basic principle has been grasped.
“The only hurdle in understanding is taking the brief amount of time to wrap one’s mind around the concept that in double-angle plots with-the-rule data are displayed on the left and against-the-rule data are displayed on the right. Once you comprehend this, you can see how compelling this type of display is for astigmatism analysis and reporting,” he said.
The tool can be downloaded here.
1 Stokes GG. 19th Meeting of the British Association for the Advancement of Science, 1849. Trans Sect 1850; 10.
2 Jaffe NS, Clayman HM. The pathophysiology of corneal astigmatism after cataract extraction. Trans Am Acad Ophthalmol Otolaryngol 1975; 79:OP615–OP630.
3 Holladay JT, Cravy TV, Koch DD. Calculating the surgically induced refractive change following ocular surgery. J Cataract Refract Surg 1992; 18:429 – 443.
4 Eydelman MB, Drum B, Holladay J, Hilmantel G, Kezirian G, Durrie D, Stulting RD, Sanders D, Wong B. Standardized analyses of correction of astigmatism by laser systems that reshape the cornea. J Refract Surg. 2006;22:81-95.
B: Double-angle plots of the preoperative corneal and the postoperative refractive astigmatism (n=78). Centroids and SDs are also shown[/caption]
The double-angle plots display data more clearly and allow for superior methods of statistical analysis compared to tools that use single-angle plots, said Dr Koch.
“Kristian Næser has made a huge contribution here with his elegant method of statistical analysis. The key difference is this – with single-angle plots, against-the-rule data are split on either side of the graph. With double-angle plots, both with-the-rule and against-the-rule data are grouped accordingly, allowing easy visualisation of trends, data centroids, confidence intervals and standard deviations,” he said.
As Dr Koch sees it, there is nothing inherently difficult in understanding double-angle plots once the basic principle has been grasped.
“The only hurdle in understanding is taking the brief amount of time to wrap one’s mind around the concept that in double-angle plots with-the-rule data are displayed on the left and against-the-rule data are displayed on the right. Once you comprehend this, you can see how compelling this type of display is for astigmatism analysis and reporting,” he said.
The tool can be downloaded here.
1 Stokes GG. 19th Meeting of the British Association for the Advancement of Science, 1849. Trans Sect 1850; 10.
2 Jaffe NS, Clayman HM. The pathophysiology of corneal astigmatism after cataract extraction. Trans Am Acad Ophthalmol Otolaryngol 1975; 79:OP615–OP630.
3 Holladay JT, Cravy TV, Koch DD. Calculating the surgically induced refractive change following ocular surgery. J Cataract Refract Surg 1992; 18:429 – 443.
4 Eydelman MB, Drum B, Holladay J, Hilmantel G, Kezirian G, Durrie D, Stulting RD, Sanders D, Wong B. Standardized analyses of correction of astigmatism by laser systems that reshape the cornea. J Refract Surg. 2006;22:81-95.